
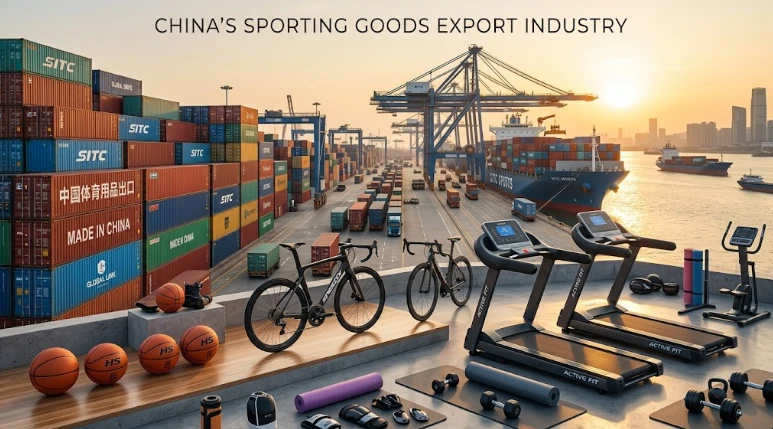
BEIJING — China’s sporting goods exports maintained upward momentum in the first half of 2026, driven by a strong second-quarter recovery. However, the sector faced noticeable margin pressures characterized by “volume expansion amid falling unit prices” across several major categories, alongside diverging regional demand.
According to data from China Customs, the cumulative export value of Chinese sporting goods reached $13.521 billion between January and June 2026, marking a 5.64% year-on-year (YoY) increase.
1. Quarterly Trajectory: Q1 Headwinds Give Way to Q2 Recovery
The sector exhibited a distinct transition from first-quarter volatility to second-quarter stabilization and rebound:
• First Quarter: Export growth faced headwind pressures, impacted by fluctuating comparison baselines from the previous year and shifting international market dynamics.
• Second Quarter: Export volume gradually recovered. In June 2026, monthly exports reached $2.343 billion, up 11.62% YoY and 3.4% month-on-month (MoM), marking the third consecutive month of YoY positive expansion.
2. Category Performance: Volume Surges as Average Unit Prices Decline
While major product categories generally maintained export value growth, performance varied across segments. The trend of higher volume paired with lower unit pricing was widely observed:
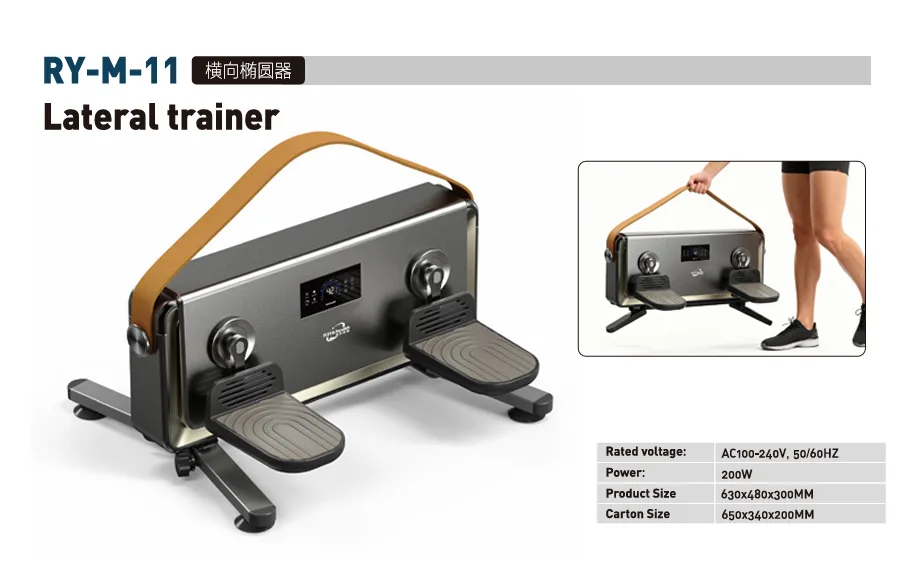
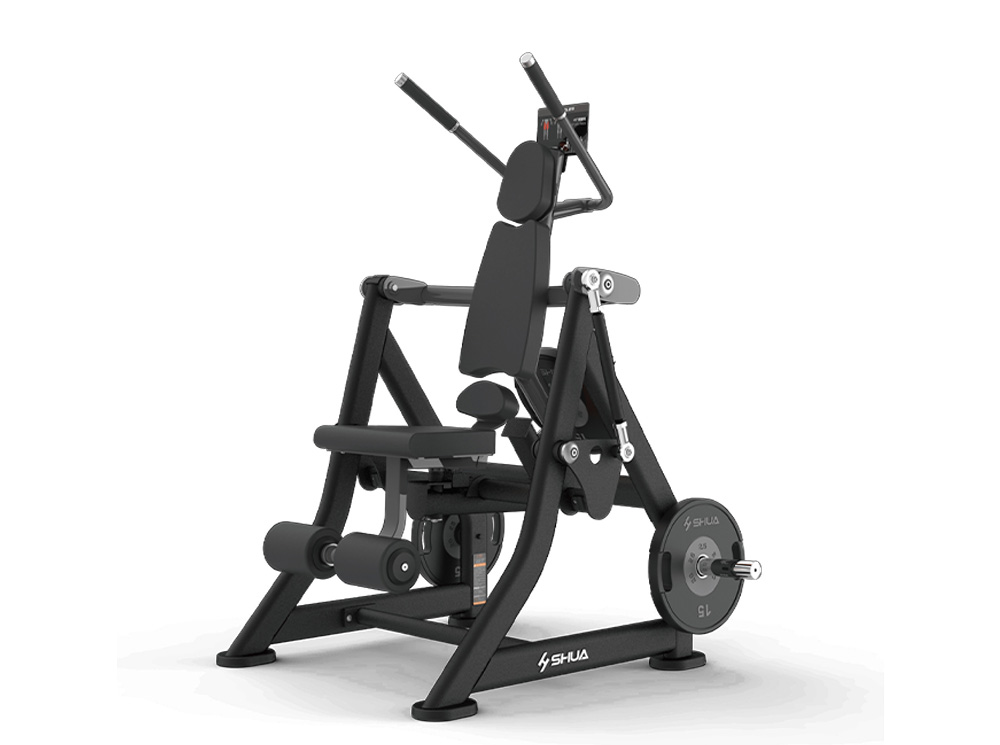
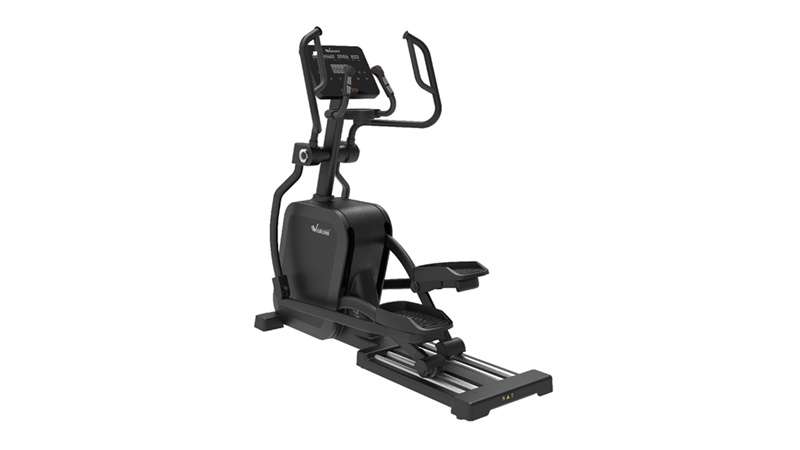
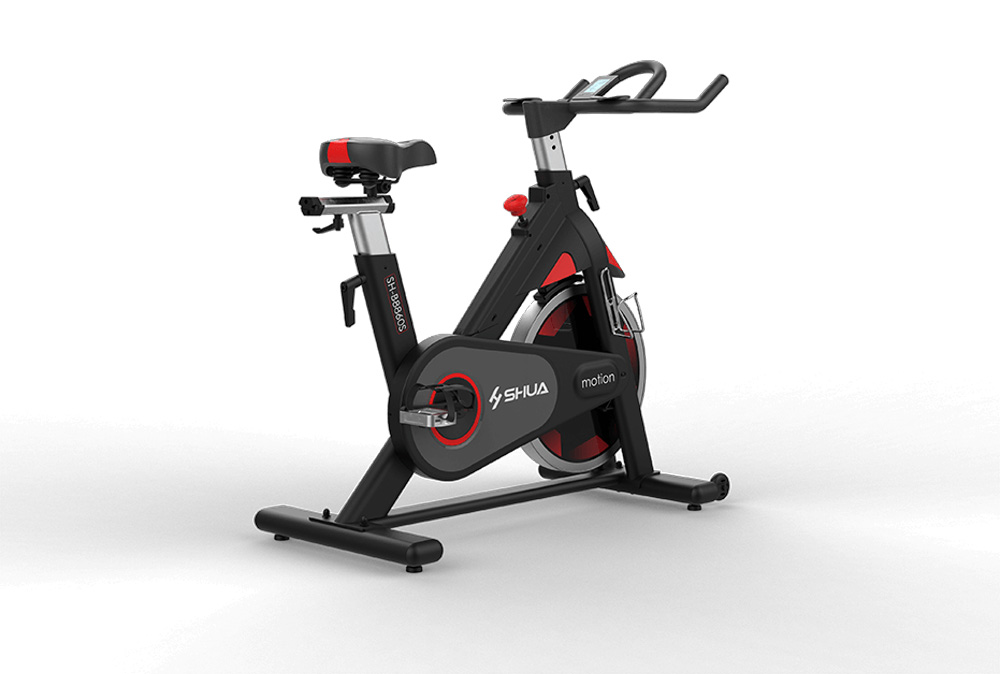
• Fitness & Rehabilitation Equipment:
o Total Segment: Reached $5.263 billion (+10.10% YoY), remaining the largest export category.
o Other Fitness & Rehab Gear: Export volume surged 22.52%, while export value rose 12.46%, as average unit prices dropped 8.21%.
o General Sports, Gymnastics & Athletics Equipment: Export volume rose 21.78% and value increased 8.47%, driven by a 10.93% reduction in average prices.
o Treadmills: Export volume gained 16.34% while export value grew by 3.74%, constrained by an 10.83% drop in unit pricing.
• Sports Protective Gear: Totaled $3.141 billion (+3.37% YoY), following the broader volume-up, price-down trend.
• Sports Balls & Inflatables: Total ball exports reached $1.110 billion (+6.74% YoY). Inflatable sports balls experienced an extreme pattern—export volume spiked by 308.64%, while unit prices dropped by 70.64%.
• Roller Skating & Winter Sports: Reached $1.364 billion (+4.51% YoY). Skateboards served as the core growth engine (+24.73% YoY), offsetting a heavy decline in skis and snow equipment (-60.37% YoY).
• Other Categories:
o Shooting Equipment: Grew 12.92% YoY to $335 million, demonstrating strong momentum with increases in both volume and average price.
o Fishing Tackle: Stood at $1.091 billion (+3.16% YoY), demonstrating stable operations.
o Golf Equipment: Rose slightly by 1.11% YoY to $641 million, with performance bifurcating across sub-segments.
3. Destination Markets: Strong Demand in Europe & Emerging Markets
China’s top ten export destinations in H1 2026 were the United States, Germany, United Kingdom, Japan, Russia, Canada, Netherlands, France, Brazil, and Spain. Together, exports to these ten countries grew 6.68% YoY, representing nearly 60% of China’s total sporting goods exports.
Regional Highlights:
• Europe (+13.39% YoY): Totaled $4.12 billion (~31% global share), acting as the single largest engine for growth. June exports alone reached $623 million (+14.31% YoY). Key markets performed strongly:
o Germany: $626 million (+16.48% YoY) — Top destination in Europe.
o United Kingdom: $563 million (+6.34% YoY).
o High Growth Markets: Poland (+19.96%), Italy (+17.82%), and France (+16.30%).
• United States (+1.10% YoY): Reached $3.978 billion, accounting for approximately 30% of total exports. Rebounding Q2 performance pushed overall cumulative
growth back into positive territory. June shipments to the US totaled $674 million (+0.15% YoY).
• Emerging Markets: Strong momentum was recorded across Latin America (+21.30%), Africa (+12.00%), and Oceania (+10.97%).
• Belt and Road Initiative (BRI) Countries (+1.92% YoY): Totaled $4.134 billion. Growth stabilized in Q2, with June exports reaching $758 million (+6.0% YoY).
o Middle East Bifurcation: Turkey (+17.10%), Israel (+22.07%), and Egypt (+29.00%) posted strong growth, whereas UAE (-32.12%), Iraq (-51.94%), Jordan (-25.90%), and Saudi Arabia (-10.39%) experienced significant pullbacks.
• Asian Markets: Exports to Asia (-2.74%) and non-China RCEP member states (-2.05%) saw slight pullbacks.
4. Import Trends: Regional Supply Chain Remains Intact
China imported $474 million worth of sporting goods in H1 2026, up 11.44% YoY.
• Top Origin: Japan (+7.68%) remained the largest source of sporting goods imports.
• Asian Supply Chain: Imports from Taiwan (+10.31%) and Vietnam (+12.58%) grew steadily, reflecting stable regional integration.
• Notable Surges: Imports from France (+117.47%) and Malaysia (+44.22%) expanded significantly.
• Decline: Imports from the United States (-34.38%) decreased substantially.