

Executive Summary
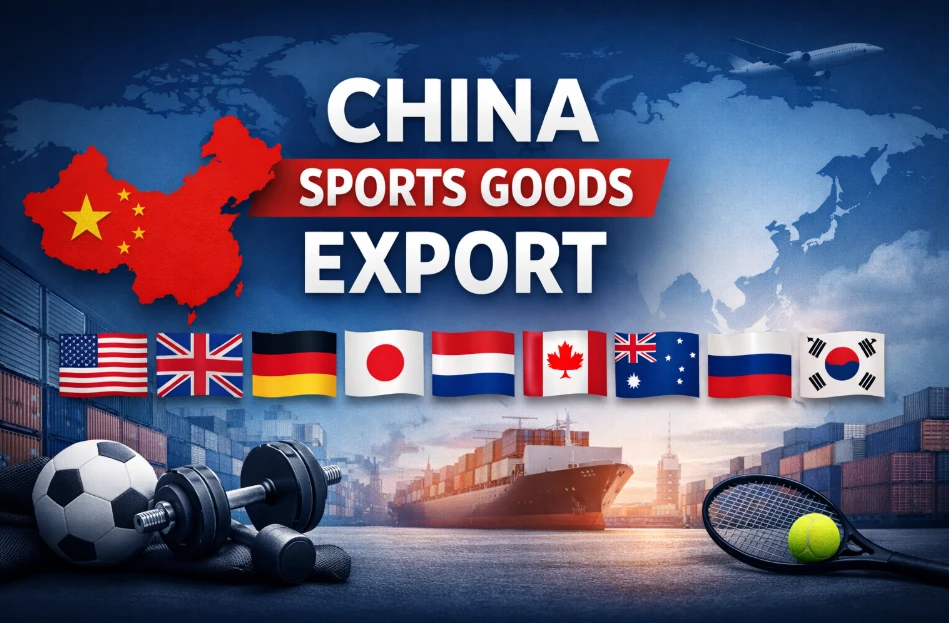
According to China Customs data, China’s cumulative export value of sporting goods reached USD 17.732 billion from January to August 2026, representing a year-on-year (YoY) growth of 5.74%.
The export market structure remained concentrated: the top 10 destination countries—the United States, Germany, the United Kingdom, Japan, Russia, Canada, the Netherlands, France, Brazil, and Spain—accounted for approximately 59% of China’s total sporting goods export value. Total exports to these top 10 markets increased by 6.53% YoY.
While major product categories continued their upward growth trajectory, individual sub-categories displayed distinct performance dynamics. The overall growth pattern was characterized by price-volume divergence: volume expansion with compressed average unit prices on one hand, and volume declines accompanied by average unit price increases on the other. Regionally, Europe and emerging markets served as the main catalysts for export expansion, whereas traditional Asian and select Middle Eastern markets faced downward pressure.
Key Market Structure Overview (Jan–Aug 2026)
- Total Export Value: USD 17.732 billion (+5.74% YoY)
- Top 10 Destination Share: ~59% of total export value (+6.53% YoY)
- Top 10 Destination Countries: United States, Germany, United Kingdom, Japan, Russia, Canada, Netherlands, France, Brazil, Spain
Part I: Sub-Category Dynamics: Sustained Expansion with Divergent Price-Volume Trends
During the Jan–Aug 2026 period, primary export categories generally sustained growth; however, significant operational divergence emerged across specific product segments.
- Volume-Driven Growth: Certain categories relied primarily on shipment volume expansion while average unit prices came under pressure.
- Value-Driven Growth: Other products demonstrated a “decreased volume, increased price” pattern, reflecting variations in market demand, product mix, and price competition across niche segments.
Detailed Breakdown by Category
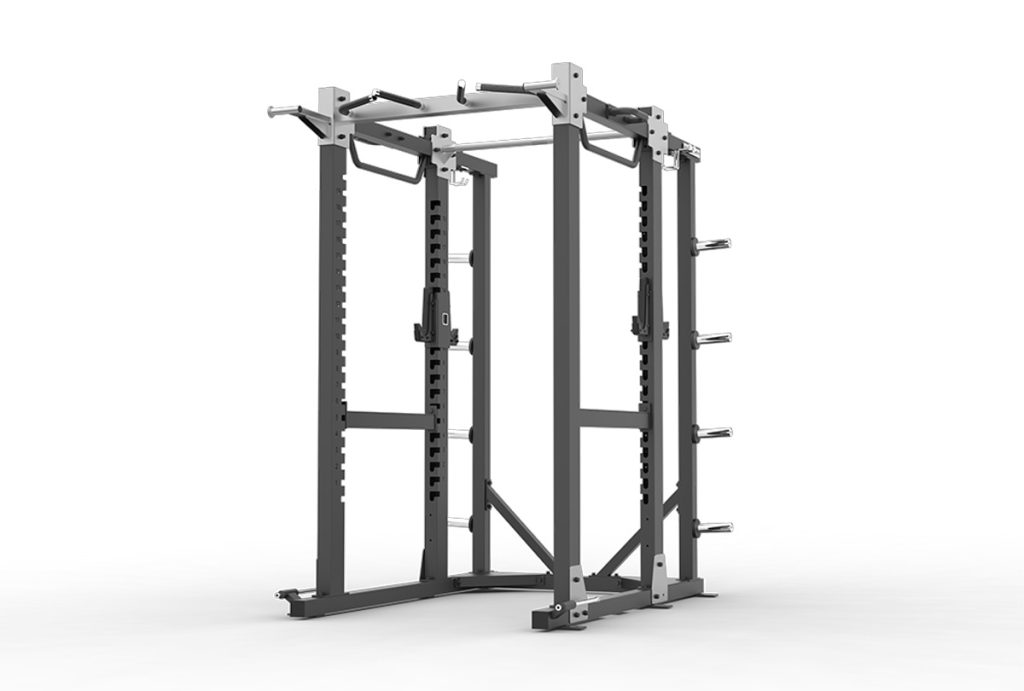
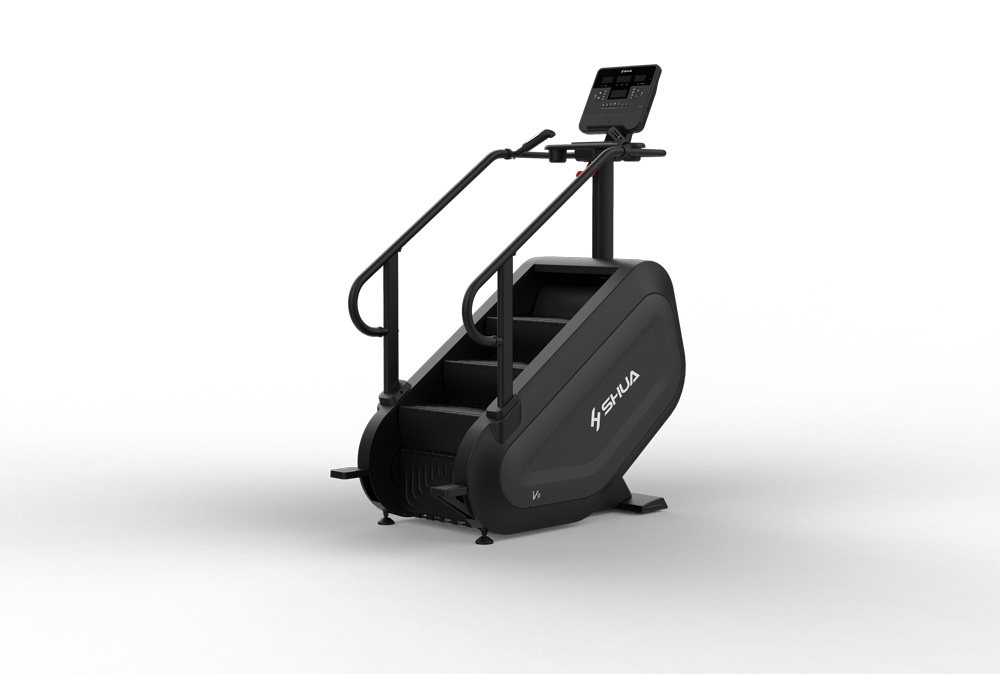
Fitness and Exercise Equipment
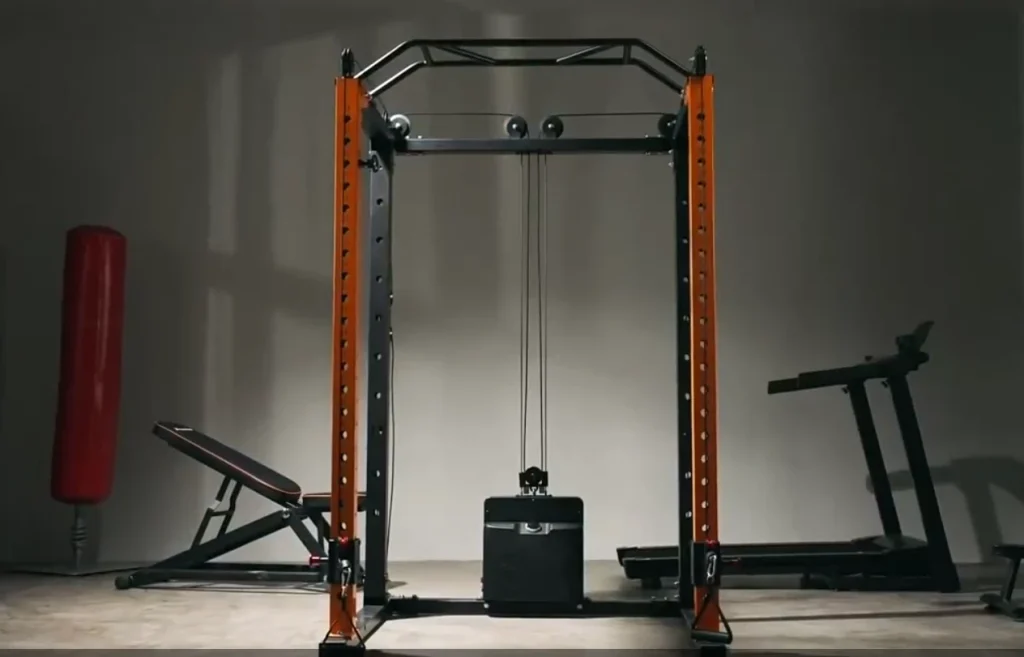
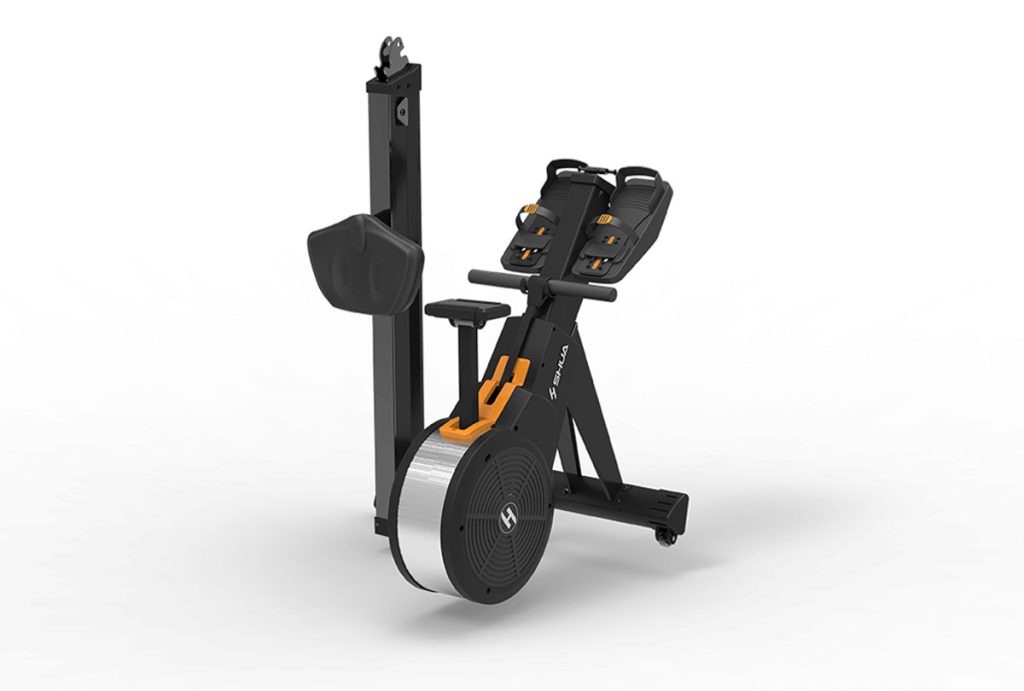
Total Category Export: USD 6.997 billion (+8.94% YoY).
Other Fitness and Rehabilitation Equipment: Export volume +16.89% YoY; export value +10.29% YoY; average unit price -5.64% YoY.
Unlisted General Physical Exercise, Gymnastics, or Athletics Goods & Equipment: Export volume +16.63% YoY; export value +8.73% YoY; average unit price -6.77% YoY.
Treadmills: Export volume +10.19% YoY; export value +3.88% YoY; average unit price -5.73% YoY.
Insight: The broad “volume up, price down” pattern indicates that category growth relied heavily on shipment volume expansion, with declining unit prices weighing on total value growth.
Sports Balls
Total Category Export: USD 1.455 billion (+6.85% YoY).
Badminton Rackets: Export value +14.99% YoY; average unit price +20.34% YoY.
Inflatable Balls (Soccer, Basketball, Volleyball): Export value +4.68% YoY; average unit price -3.52% YoY (volume expansion driven).
Other Inflatable Sports Balls: Export volume surging by +269.27% YoY against a +17.83% YoY increase in export value—demonstrating extreme volume-price divergence. Key destination markets experiencing exponential volume surges included Egypt (+16,440.08%), Germany (+2,571.8%), and Israel (+2,275.81%).
Shooting Equipment
Total Category Export: USD 458 million (+14.64% YoY).
Weapon Sights: Export value +12.61% YoY; average unit price +7.55% YoY.
Roller Skating and Ice/Snow Equipment
Total Category Export: USD 1.973 billion (+4.67% YoY).
Scooters: Accounted for ~78% of total category exports, with export value +3.43% YoY and average unit price +1.69% YoY.
Fishing Tackle
Total Category Export: USD 1.439 billion (+4.13% YoY).
Fishing Reels: Export volume +16.52% YoY; export value -0.16% YoY; average unit price -14.32% YoY.
Golf Equipment
Total Category Export: USD 824 million (+0.59% YoY).
Golf Balls: Export volume -24.75% YoY; export value -21.54% YoY; average unit price +4.27% YoY.
Part II: Regional Export Analysis: European & Emerging Market Drivers vs. Traditional Market Headwinds
Export performance varied substantially across major global regions in Jan–Aug 2026:
- Europe (+12.6%): Emerged as the primary growth engine for China’s sporting goods exports.
- North America (+1.79%): Maintained overall stability.
- Emerging Markets: Posted fast-paced growth across Latin America (+18.19%), Africa (+16.3%), and Oceania (+9.51%).
- Belt and Road Initiative (BRI) Countries (+3.21%): Delivered steady, moderate growth.
- Asia (-1.48%) & Non-China RCEP Member States (-0.29%): Experienced soft or contracting demand.
1. The United States
Jan–Aug Cumulative Export Value: USD 5.193 billion (+1.36% YoY), representing approximately 29% of China’s total sporting goods export value.
August Single-Month Performance: Export value reached USD 645 million, up 12.96% YoY and 11.79% month-on-month (MoM).
2. The European Market
Jan–Aug Cumulative Export Value: USD 5.229 billion (+12.6% YoY).
August Single-Month Performance: Export value reached USD 541 million, up 3.44% YoY but down 4.75% MoM.
Top 5 European Destinations: Germany (+15.61%), United Kingdom (+3.9%), Russia (+23.7%), Netherlands (+8.45%), and France (+15.78%).
Top 10 European Concentration: Exports to the top 10 European markets totaled USD 4.26 billion, representing 81.47% of total exports to Europe and growing by 14.09% YoY.
Strategic Outlook: While Germany and the UK remain core anchor markets, growth momentum in Western and Southern Europe warrants closer strategic attention. Industry exporters are advised to consolidate traditional strongholds while tailoring market layouts to specific regional demand profiles.
3. Emerging Markets & Belt and Road Initiative (BRI) Countries
- Jan–Aug Cumulative Export Value (BRI): USD 5.463 billion (+3.21% YoY).
- August Single-Month Performance (BRI): Export value reached USD 653 million, up 5.32% YoY but down 3.4% MoM.
- High-Growth BRI Markets: Russia (USD 571 million, +23.7%), Turkey (+18.14%), Poland (+17.43%), and Vietnam (+14.19%).
- BRI Markets Under Pressure: South Korea (-5.64%), Indonesia (-5.84%), Saudi Arabia (-15.86%), Singapore (-23.26%), and the UAE (-28.16%).
Market Divergence Analysis: Although export volume to BRI markets demonstrated resilience, growth was far from uniform. Strong momentum in Russia, Poland, Vietnam, and Turkey provided vital incremental volume. Conversely, pullbacks in East Asia, Southeast Asia, and the Middle East dragged down overall BRI velocity.
Strategic Insights & Outlook
The export data for January–August 2026 highlights a shifting trade environment for China’s sporting goods manufacturers:
Transitioning from Scale to Differentiation: Reliance on volume growth at the expense of average unit prices presents margin challenges across key exercise and ball categories. Exporters must pivot toward value-added production, product differentiation, and brand equity building.
Precision Targeting across Regional Markets: Given the distinct growth profiles observed across Western Europe, Latin America, Southeast Asia, and the Middle East, industry players must move away from generic expansion strategies. Monitoring localized demand, navigating changing trade environments, and optimizing product-market fit will be essential to ensuring sustainable, long-term export growth.
Read more…



You must be logged in to post a comment.